How to Create a Graph Line in Python
In this tutorial, you'll learn how to create visually appealing line graphs in Python using Matplotlib. Line graphs are commonly used to visualize trends and relationships in data over time or across different categories. Whether you're a data scientist, analyst, or programmer, mastering the creation of line graphs is a valuable skill for effectively communicating insights from your data.
By the end of this tutorial, you'll have the knowledge and skills to create professional-quality line graphs in Python using Matplotlib for your data visualization needs.
Getting Started:
First you will have to download & install the Python IDLE's, here's the link for the Integrated Development And Learning Environment for Python https://www.python.org/downloads/.
In this tutorial, we'll cover the following topics:
- Installing Matplotlib: We'll start by installing the Matplotlib library if you haven't already done so. Matplotlib is a powerful plotting library in Python that provides a wide range of functionalities.
- Generating Sample Data: Instead of using NumPy arrays, we'll generate sample data using Python lists to demonstrate how to plot a basic line graph.
- Plotting a Simple Line Graph: You'll learn how to use Matplotlib to plot a simple line graph from the sample data.
- Saving and Exporting Graphs: Finally, you'll learn how to save your line graph as an image file or export it to different formats for sharing or further analysis using Matplotlib.
Creating Main Function
This is the main function of the application. The following code will display a simple GUI in terminal console that will display program. To do this, simply copy and paste these blocks of code into the IDLE text editor.- import matplotlib.pyplot as plt
- x=[]
- y=[]
- print("\n=============== Grap Line ===============\n")
- x1 = int(input("Enter your first x line: "))
- x.append(x1)
- x2 = int(input("Enter your second x line: "))
- x.append(x2)
- y1 = int(input("Enter your first y line: "))
- y.append(y1)
- y2 = int(input("Enter your second y line: "))
- y.append(y2)
- plt.plot(x, y)
- plt.xlabel('x - axis')
- plt.ylabel('y - axis')
- plt.title('Grap Line')
- plt.show()
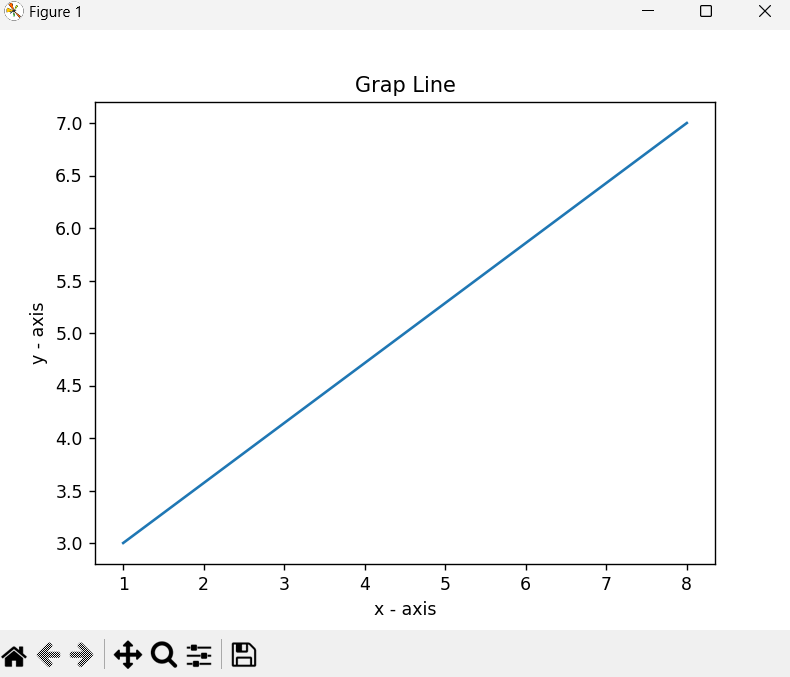
This Python script uses Matplotlib to plot a line graph based on user-provided coordinates. It prompts the user to enter the x and y coordinates for two points, then plots a line connecting these two points on the graph.
It labels the x and y axes and sets the title of the graph. Finally, it displays the graph using Matplotlib's show() function.
Output:

The How to Create a Graph Line in Python source code that I provide can be download below. Please kindly click the download button.
There you have it we successfully created How to Create a Graph Line in Python. I hope that this simple tutorial help you to what you are looking for. For more updates and tutorials just kindly visit this site. Enjoy Coding!
More Tutorials for Python Language
Add new comment
- 131 views

