How to Create a Doughnut Graph Using PHP/MySQLi
Submitted by janobe on Wednesday, December 26, 2018 - 22:52.
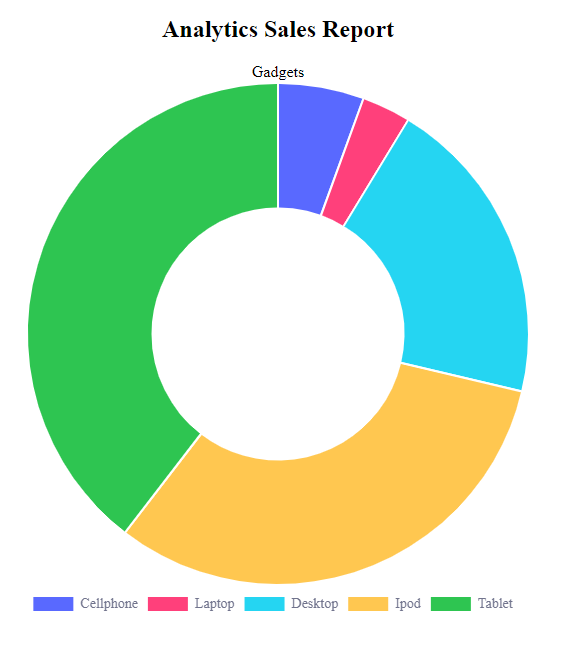
If you want to be creative in creating statistics sales report you can try this simple program that I’m going to share to you. This time, I will teach you how to create your own custom doughnut graph using Chart.js and PHP/MySQLi. This kind of graph demonstrates the products sale in different slices depending on the sales of the products. It also automatically set a colour to easily identify each products. Let’s begin.
For any questions about this article. You can contact me @
Email – [email protected]
Mobile No. – 09305235027 – TNT
Or feel free to comment below.
Creating Database
Create a database named “salesdb”. Execute the following query for adding table and inserting data in the table.- --
- -- Dumping data for table `tblsales`
- --
- (1,'Cellphone', 1400),
- (2,'Laptop', 800),
- (3,'Desktop', 5052),
- (4,'Ipod', 8030),
- (5,'Tablet', 10000);
Creating HTML and PHP Script
Step 1
Create and landing page and name it “index.php”Step 2
Do the following codes for the index page.- <!DOCTYPE html>
- <html lang="en">
- <head>
- <meta http-equiv="Content-Type" content="text/html; charset=utf-8" />
- <meta name="viewport" content="width=device-width, initial-scale=1.0">
- <title>Graph</title>
- </head>
- <body>
- <div style="width:40%;hieght:20%;text-align:center">
- <h2 class="page-header" >Analytics Sales Report </h2>
- <div>Gadgets</div>
- <canvas id="chartjs_doughnut"></canvas>
- </div>
- </body>
- </html>
Step 3
Add the following extension to accessChart.js Libraries.
- <script src="//code.jquery.com/jquery-1.9.1.js"></script>
- <script src="//cdnjs.cloudflare.com/ajax/libs/Chart.js/2.4.0/Chart.min.js"></script>
Step 4
Create a PHP script for fetching the data in the database.- <?php
- if (!$con) {
- # code...
- }else{
- $sql ="SELECT * FROM tblsales";
- $chart_data="";
- $productname[]=$row['Product'];
- $sales[] = $row['TotalSales'];
- }
- }
- ?>
Step 5
Create a JavaScript script for displaying a graph.- <script type="text/javascript">
- var ctx = document.getElementById("chartjs_doughnut").getContext('2d');
- var myChart = new Chart(ctx, {
- type: 'doughnut',
- data: {
- labels:<?php echo json_encode($productname); ?>,
- datasets: [{
- backgroundColor: [
- "#5969ff",
- "#ff407b",
- "#25d5f2",
- "#ffc750",
- "#2ec551",
- "#7040fa",
- "#ff004e"
- ],
- data:<?php echo json_encode($sales); ?>,
- }]
- },
- options: {
- legend: {
- display: true,
- position: 'bottom',
- labels: {
- fontColor: '#71748d',
- fontFamily: 'Circular Std Book',
- fontSize: 14,
- }
- },
- }
- });
- </script>
Full Source Code
- <?php
- if (!$con) {
- # code...
- }else{
- $sql ="SELECT * FROM tblsales";
- $chart_data="";
- $productname[]=$row['Product'];
- $sales[] = $row['TotalSales'];
- }
- }
- ?>
- <!DOCTYPE html>
- <html lang="en">
- <head>
- <meta http-equiv="Content-Type" content="text/html; charset=utf-8" />
- <meta name="viewport" content="width=device-width, initial-scale=1.0">
- <title>Graph</title>
- </head>
- <body>
- <div style="width:40%;hieght:20%;text-align:center">
- <h2 class="page-header" >Analytics Sales Report </h2>
- <div>Gadgets</div>
- <canvas id="chartjs_doughnut"></canvas>
- </div>
- </body>
- <script src="//code.jquery.com/jquery-1.9.1.js"></script>
- <script src="//cdnjs.cloudflare.com/ajax/libs/Chart.js/2.4.0/Chart.min.js"></script>
- <script type="text/javascript">
- var ctx = document.getElementById("chartjs_doughnut").getContext('2d');
- var myChart = new Chart(ctx, {
- type: 'doughnut',
- data: {
- datasets: [{
- backgroundColor: [
- "#5969ff",
- "#ff407b",
- "#25d5f2",
- "#ffc750",
- "#2ec551",
- "#7040fa",
- "#ff004e"
- ],
- }]
- },
- options: {
- legend: {
- display: true,
- position: 'bottom',
- labels: {
- fontColor: '#71748d',
- fontFamily: 'Circular Std Book',
- fontSize: 14,
- }
- },
- }
- });
- </script>
- </html>