How to Create a Doughnut Graph Using PHP/MySQLi
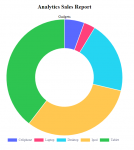
If you want to be creative in creating statistics sales report you can try this simple program that I’m going to share to you. This time, I will teach you how to create your own custom doughnut graph using Chart.js and PHP/MySQLi. This kind of graph demonstrates the products sale in different slices depending on the sales of the products. It also automatically set a colour to easily identify each products. Let’s begin.